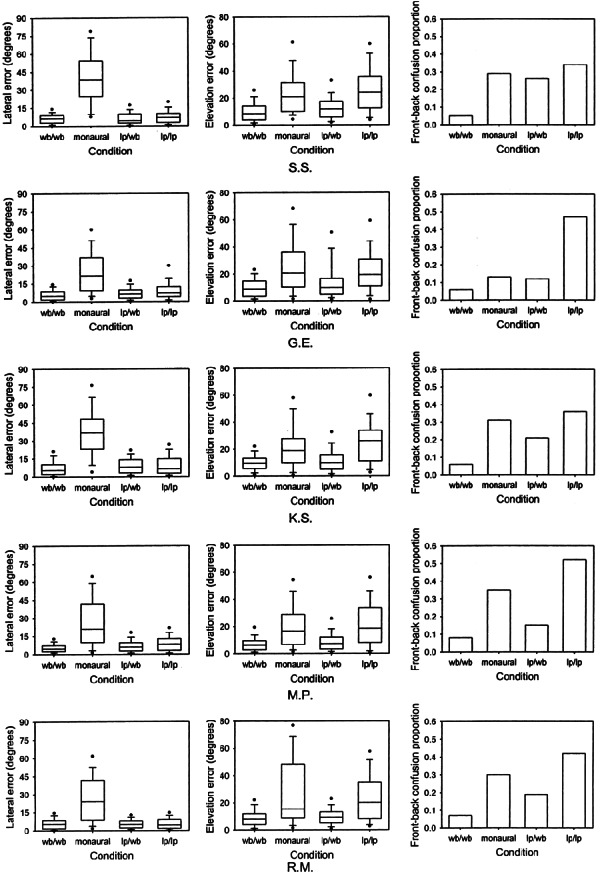
Figure 1.

Unsigned lateral errors, unsigned elevation errors, and proportion of front–back confusions for each condition in the main experiment for each of the five participants. Box plots show 5th, 10th, 25th, 50th, 75th, 90th, and 95th percentiles.
