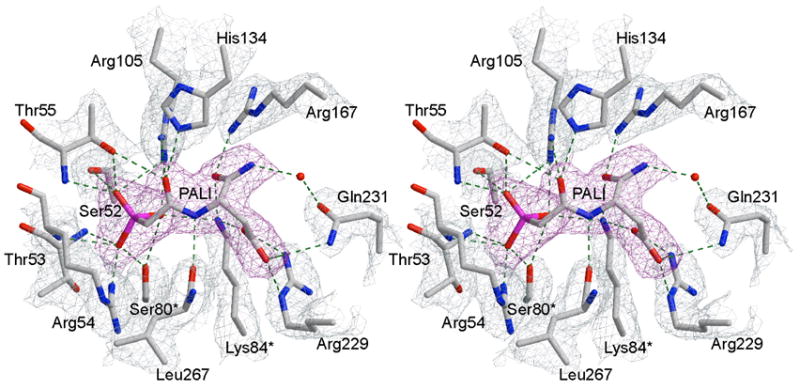
Figure 4.

Stereoview of the active site with PALI bound. The 2Fo–Fc simulated annealing electron density map, contoured at 1.0 σ, with PALI (magenta) omitted from the map calculation. The refined positions of the active site residues are overlaid onto the 2FO-FC electron density map (sky blue), contoured at 1.2 σ. The hydrogen bonding interactions between the inhibitor and enzyme are shown as dotted lines.
