
Figure 6.
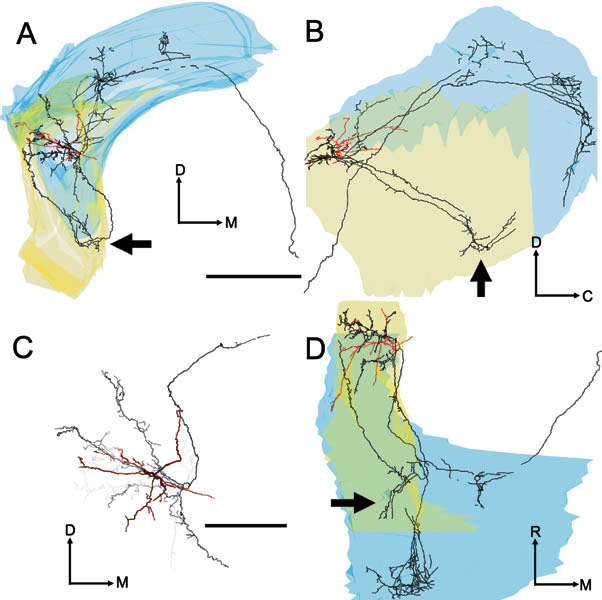
Four images of the soma and dendrites (red) and the axon (black) of the On-C cell (unit 212, BF-5.9 kHz). A Transverse view. B Sagittal view. C Higher-power transverse view showing the dendrites and local axon in high-quality mode and with “depth cueing” switched on. Processes rostral to the soma become increasingly pale with increasing distance away from the soma. D Plan view. Scale bar for A, B, D = 1000 μm and for C = 500 μm. The axonal branch which directly innervates the caudal PVCN is clearly visible in all three orientations of the tracing (see arrows). This pattern contrasts with the course taken by the PVCN innervation of unit 282 (Fig. 5), which had similar BF but was located more caudally in AVCN.