
Figure 9.
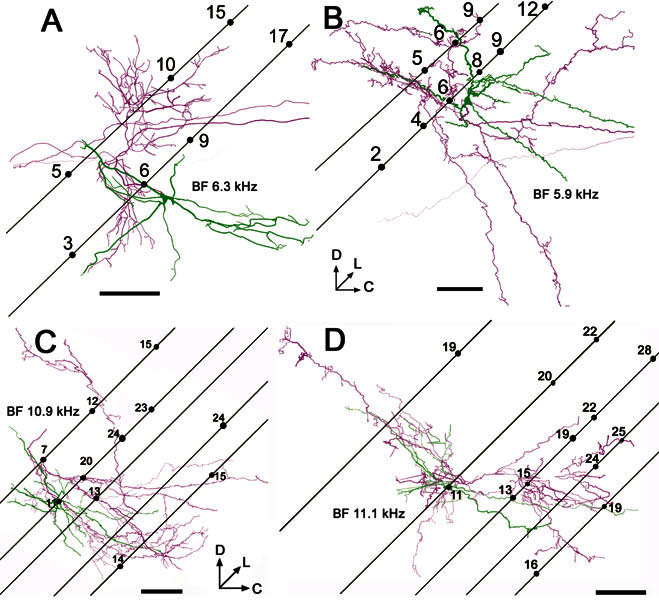
Reconstructions of the soma and dendrites (green) and the proximal axon (magenta) of onset units viewed in the sagittal plane. In each case, the positions of associated electrode tracks are superimposed to indicate the frequency gradient within AVCN. The electrodes were inserted at 45° relative to the horizontal stereotaxic plane (as defined by Rapisarda and Bacchelli 1977), and the angle of the tracks was found by reconstructing them along with the labeled cells. Subsequently, for these four cells the orientation was defined in relation to the electrode tracks and not to the histological section. Some tracks were clearly visible over part of their course because of blood entering them after removal of the electrode. Numbers on the tracks indicate the BFs of recorded units in kHz. The reconstructed images are shown with “depth cueing” so that processes that are deep to the plane of the figure become increasingly faint, while processes that come out of the page toward the viewer are made darker. A On-C unit 282, BF-6.3 kHz B On-C unit 212, BF-5.9 kHz; C On-L unit 284, BF-10.9 kHz; D On-L unit 286, BF-11.1 kHz. In this figure neuronal processes are rendered with their fiber thickness in correct proportion. Scale bars = 200 μm.