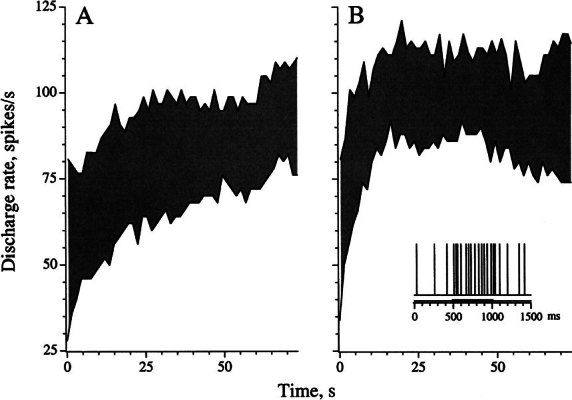
Figure 6.

Adaptation of slow and fast response components. Shock trains, 0.5-s duration, 333 shocks/s are repeated every 1.5 s. There are a total of 50 trains. Rates are calculated during each train (T1, dark bar in inset to B) and in the 0.5 s immediately preceding period (T0). The slow response builds up with successive trains. The fast response is measured as the difference in rates between T1 and the immediately preceding T0 (shaded areas). A A noncalyx HC unit (cv* = 0.16), ipsilateral stimulation. The slow response continues to increase during the paradigm, while the fast response declines from 52 to 34 spikes/s. B A calyx SC unit (cv* = 0.25), midline stimulation. The slow response declines from 57 to 39 spikes/s; the fast response declines from 47 to 40 spikes/s.
