
Figure 7.
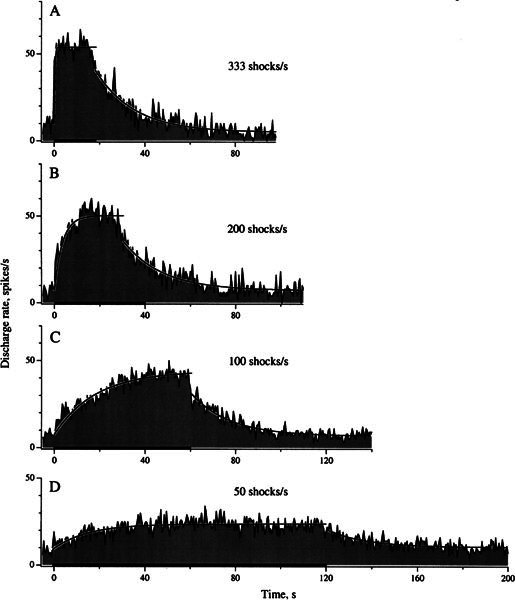
Fast and slow responses behave differently as shock frequency changes. Same unit as in Fig. 4. Shock frequencies: 333 (A), 200 (B), 100 (C), and 50/s (D); train duration increases so that the number of shocks remains at 6000. A fast response is seen only at the beginning of the higher-frequency shock train. A slow response is seen in the post-train period at all frequencies and is also observed uncontaminated by a fast response during low-frequency shock trains. Separate simple exponentials are fit to the per-train response buildup and post-train response decay.