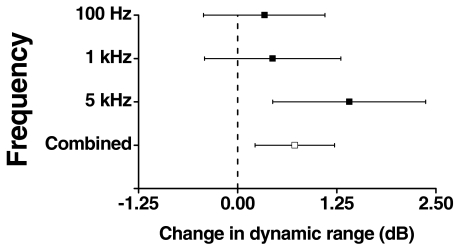
FIG. 3.
The change in the dynamic range of a sine wave (from threshold to the conservative estimate of the uncomfortable loudness level) by the addition of Gaussian noise. The figure shows the estimated mean and 95% confidence interval for 100 Hz, 1 kHz, and 5 kHz stimulation across all subjects based on a least square means analysis. The combined effect across frequencies and subject is also shown.

