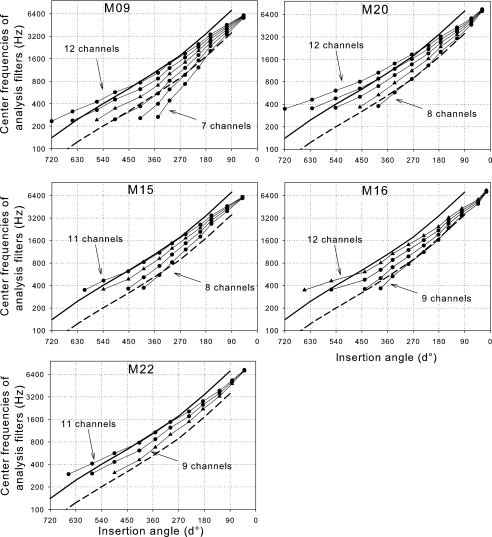
FIG. 4.
Center frequencies of analysis filters of CIS strategies tested. The angular position of each electrode stimulated for each strategy is indicated on the abscissa. Close symbols: fittings used for data shown in Figures 1 and 2; triangles: fittings that subjects decided to use in daily life. The solid lines represent Greenwood’s frequency-position function (1990) for a normal ear, using proportion of basilar length (a=0.06; k=1; total length: 35 mm) adapted for angles. The dashed lines represent the same function shifted down by one octave.

