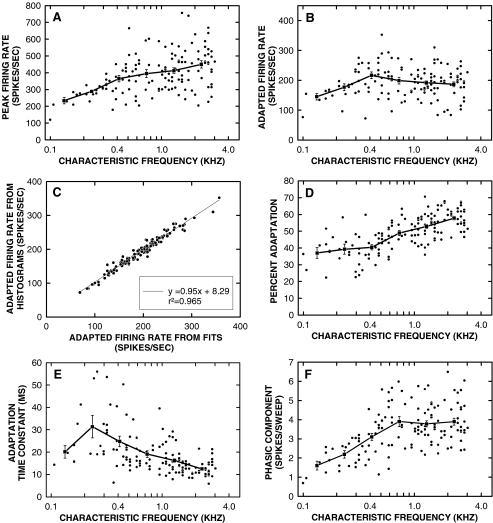
FIG. 4.
Analysis of PST histogram parameters. Circles represent data for individual units, whereas the squares with error bars (SEM) are the means for the same data when grouped into the CF bins. (A) Units showed a progressive increase in the peak firing rate across CF (p < 0.001). (B) The adapted firing rates were more constant (only the 0.41-kHz bin was significantly different from the 0.13-kHz bin). (C) The adapted rates directly measured from the histograms showed a near one-to-one relationship (linear regression slope = 0.95) with the predicted asymptotic rates from single exponential fits, indicating that this stage of adaptation is complete by the end of the 100-ms stimulus. (D) Percent adaptation was greatest in high CF units (p < 0.001). (E) Units with higher CFs generally adapted more quickly (p < 0.001). Time constants were in the range of those classified as “short-term” adaptation in mammals. (F) The number of spikes in the phasic component of the response grew up to the 0.73-kHz CF bin (p < 0.001). Above this bin, the phasic component remained constant. (n ≥ 137 for each scatter plot.)

