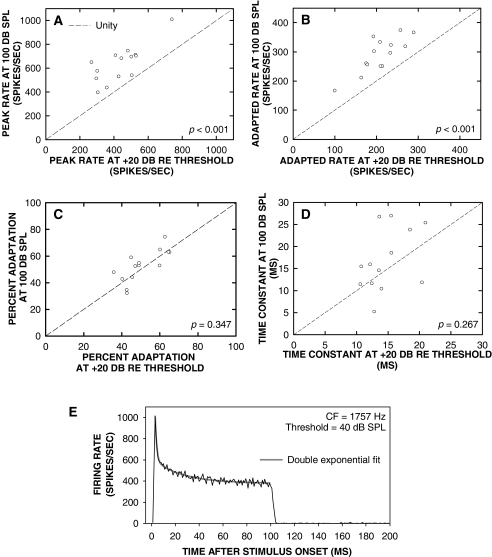
FIG. 5.
Summary of stimulus level manipulation. Peak (A) and adapted (B) rates were increased at the higher stimulus level, but the percent adaptation (C) and time constant (D) were stable. (E) Histogram collected at 100 dB SPL where the adaptation function was better described as a double exponential decay process. This histogram was excluded from the analysis of time constant in D. (n = 14 for A, B, and C; n = 13 for D.)

