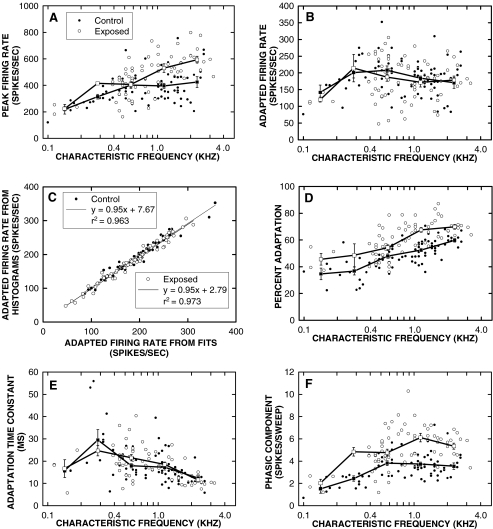
FIG. 9.
Analysis of PST histogram parameters for the acoustic overexposure. (A) Peak firing rates were elevated after the exposure in the 1.14- and 2.29-kHz bins (p < 0.05). (B) The adapted firing rates were unchanged. (C) In both control and exposed units, the adapted rates directly measured from the histograms were comparable to the asymptotic rates predicted from single exponential fits (linear regression slopes = 0.95 for both conditions), indicating that the short-term adaptation stage was complete by the end of the stimulus for both groups. (D) Percent adaptation was increased in the three highest CF bins (p < 0.05). (E) The short-term adaptation time constant was unaltered by the exposure. (F) The phasic component of the response was significantly larger (p < 0.05) in exposed units for all CF bins except 0.14 kHz. (For parameters that relied on single exponential fits, the four histograms with double exponential adaptation functions were excluded from the analysis. n ≥ 78 for each control scatter plot, n ≥ 64 for each exposed scatter plot.)

