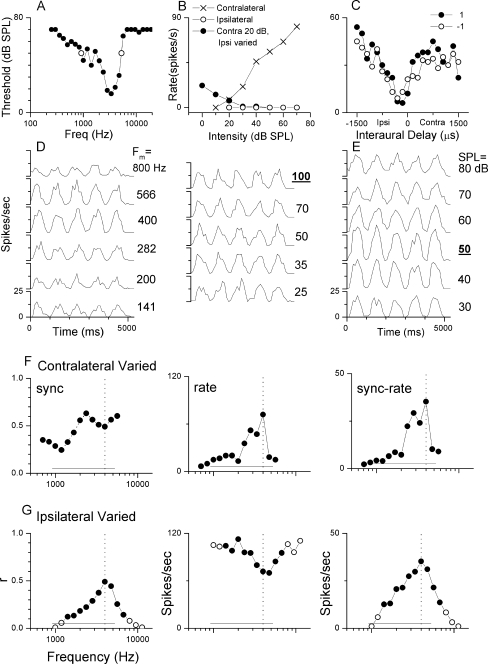
FIG. 1.
Complete data set for one neuron. A. Tuning curve of neuron with a CF of 3,363 Hz. Open circles represent 50 dB, which was the neuron’s best intensity. B. Rate level functions demonstrating a monotonic contralateral response (X symbols), limited ipsilateral response (open circles), and the inhibitory effect of ipsilateral stimulation when the contralateral ear was held constant at 20 dB (solid circles). C. ITD response to broad band noise, including neuronal response to fully correlated noise (solid circles) and anticorrelated noise (open circles). D. Response to binaural beat with modulation frequencies from 800 to 25 Hz. The neuron was tested at 100 Hz. E. Intensity response to the binaural beat, 50 dB was used for testing. F–G. Responses to mismatched frequencies in the binaural beat stimulus with the other ear held constant at 4,000 Hz. Frequencies where there was significant synchrony to the binaural beat stimulus (Rayleigh test of uniformity, p < 0.001) is represented by the solid circles; open circles did not meet the synchrony criterion. The solid line near the bottom is the range of frequencies with above threshold response to tones. The vertical dashed line is the frequency that was held constant.

