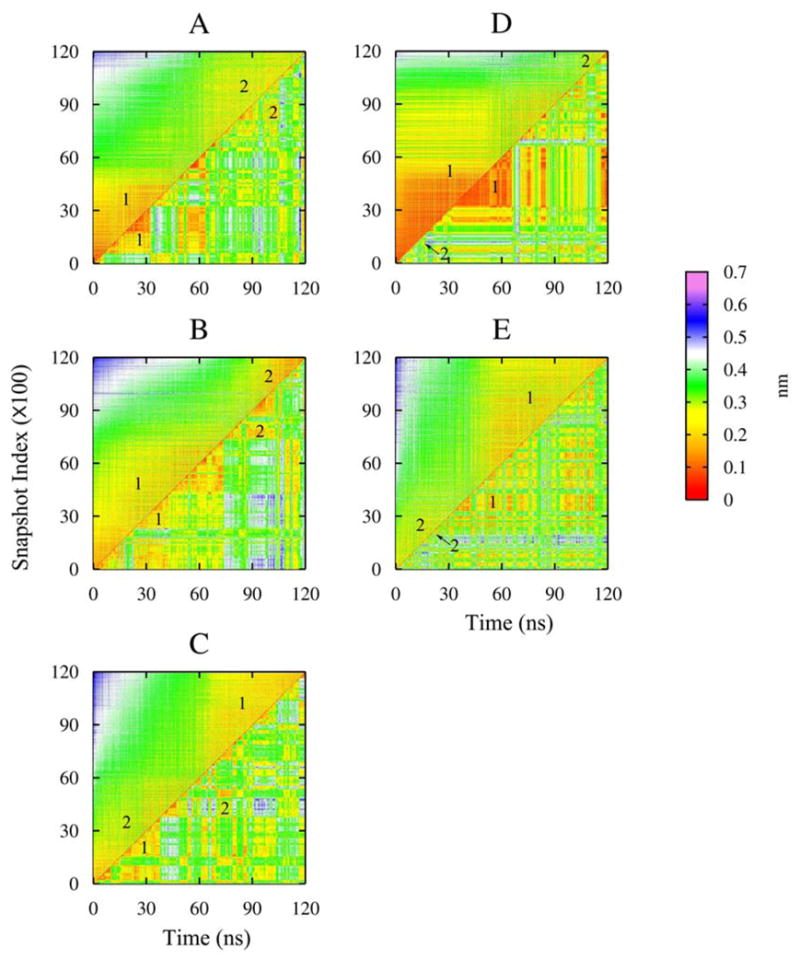
Figure 2.

RMSD matrix of each simulation, showing the RMSD of the principal component arranged snapshots according to the first principal components (upper-left triangle) and RMSD with respect to simulation time (lower-right triangle). The dominant conformational clusters are labeled as 1 and 2.
