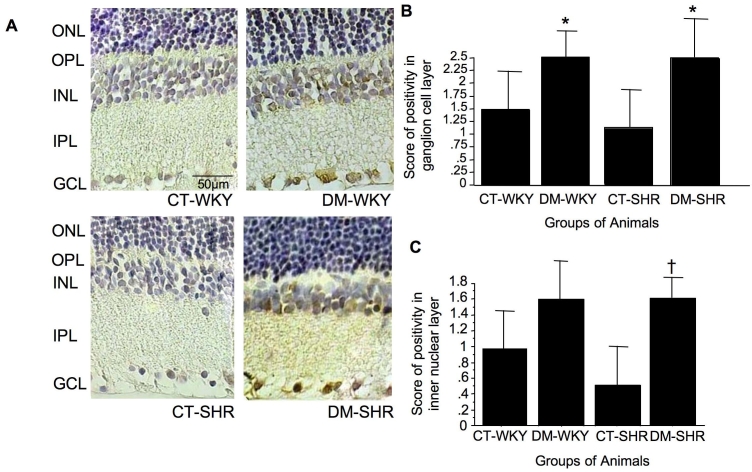
Figure 4.
Retinal expression of p27Kip1 in retina evaluated through immunohystochemistry assay. In (A), we can see a representative immunohistochemical staining for p27Kip1 in retina of control and diabetic Wistar Kyoto (WKY) rats and spontaneously hypertensive rats (SHR). The brownish color represents staining for p27Kip1, and the blue color represents the staining of retinal tissue with hematoxylin. Original magnification 1000x, the bar in the figure represents a scale of 50µm. The graphs represents the score of positivity of p27Kip1 in retinal slides expressed by mean±SD in ganglion cell (B) and inner nuclear (C) layers. Asterisk (*) is p=0.05 versus CT-WKY and CT-SHR, and dagger (†) is p=0.02 versus CT-SHR.

