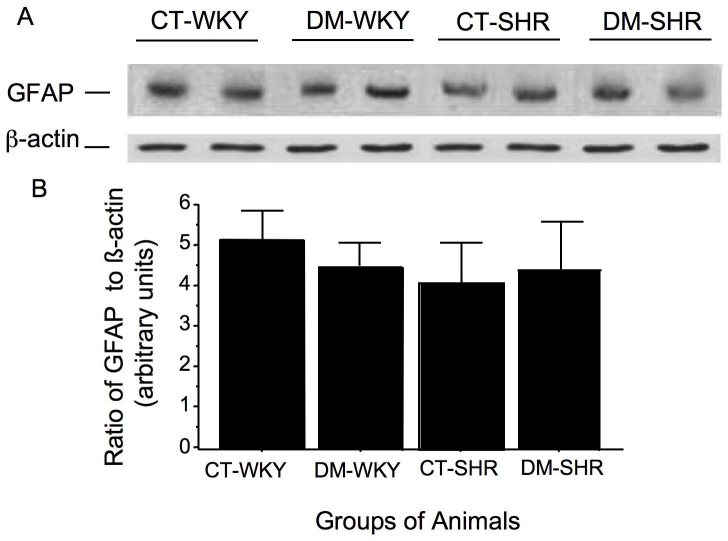
Figure 6.
Retinal expression of glial fibrillar acidic protein assayed by western blot. A: The membranes were incubated with antibody against glial fibrillar acidic protein (GFAP) in total retinal lysates. The columns represent the band densities (ratio of GFAP to β-actin) expressed in arbitrary densitometric units. Mean±SD of five independent experiments. B: Band densities (ratio of GFAP to β-actin) expressed in arbitrary densitometric units. The used symbols are CT-WKY for control WKY, DM-WKY for diabetic WKY, CT-SHR for control SHR and DM-SHR for diabetic SHR.

