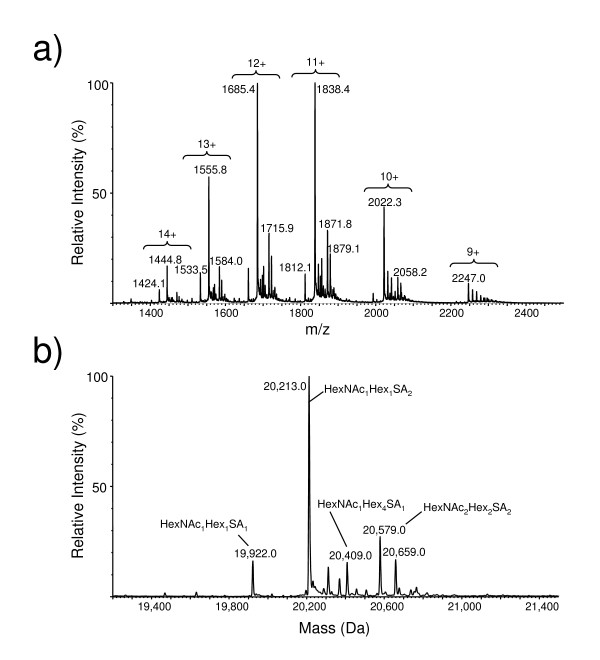
Figure 6.
ESI-MS analysis of the intact IFNα2b glycoprotein. A) ESI mass spectrum exhibiting the glycoform profiles associated with each charge state of the protein and B) the glycoprotein molecule weight profile reconstructed from the mass spectrum in panel A. The most intense peak at 20,213 Da appears to be composed of the mature peptide chain plus a single core type-1 disialylated glycan (Hex1HexNAc1SA2).

