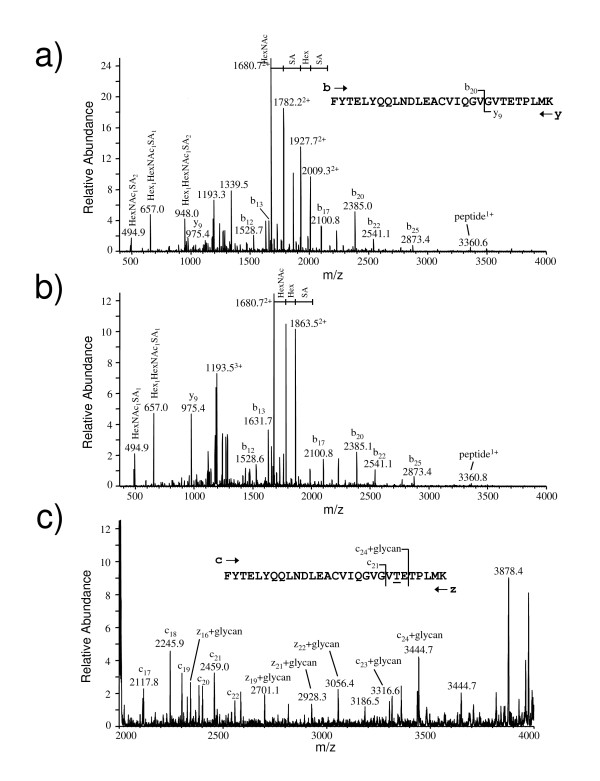
Figure 7.
CID and ETD analysis of the tryptic glycopeptides from IFNα2b. A) CID-MS/MS spectrum of the triply protonated ion at m/z 1426.8 corresponding to the disialylated glycopeptide of T84-112. The spectrum is dominated by the sequential neutral loss of the glycan components from the doubly protonated glycopeptide ion. The principal b and y fragment ions arising from fragmentation of the peptide backbone are indicated in the spectrum as are the compositions the glycan oxonium ions observed m/z 494.9, 657.0 and 948.0, respectively. The sequence of the peptide is provided in the inset. B) CID-MS/MS spectrum of the triply protonated ion at m/z 1340.8 corresponding to the monosialylated glycopeptide of T84-112. Note that the neutral loss corresponding to a second sialic acid is missing from this spectrum as is the corresponding oxonium ion at m/z 948.0. C) ETD MS/MS spectrum of the triply protonated, monosialylated T84-112 glycopeptide at m/z 1340.8. The higher m/z region of the ETD spectrum contained the most informative fragment ions and is presented here. The c ion series indicated in the spectrum clearly identified the site of O-linkage as Threonine 106 of the mature protein.

