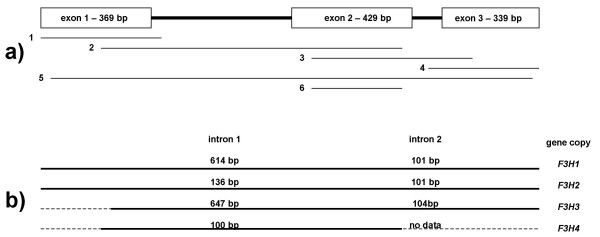
Figure 1.
The structure of wheat F3H. Different gene segments referred in the paper text and tables are indicated in the figure part (a), length of introns of the different T. aestivum F3H gene copies are indicated in part (b); partial sequences are extended with dotted lines, whereas solid lines correspond to sequences cloned and analysed in the present study.

