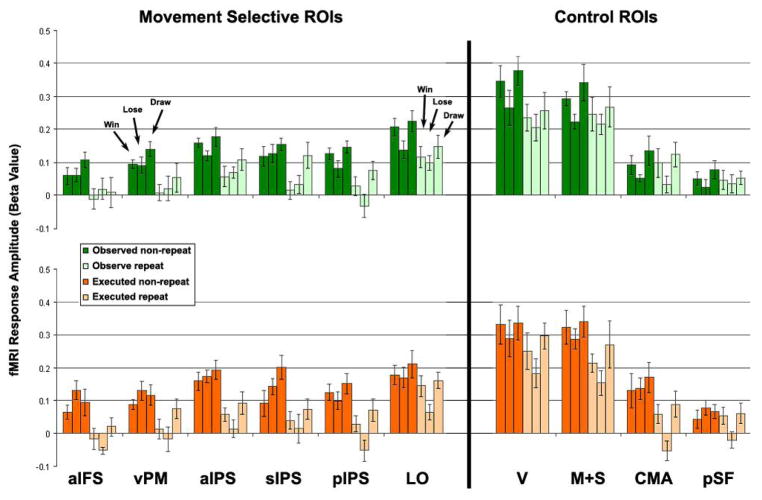
Figure 8.
Region of interest (ROI) analysis split according to trial outcomes. Top row. Visual adaptation. Comparison of fMRI response amplitudes in six conditions: observed non-repeat win, lose, and draw (all in dark green) and observed repeat win, lose, and draw (all in light green). Bottom row. Motor adaptation. Comparison of fMRI response amplitudes in six conditions: executed non-repeat win, lose, and draw (all in dark orange) and executed repeat win, lose, and draw (all in light orange). Error bars, SEM across subjects. See Behavioral and Outcome Analyses in Results section for statistical details.

