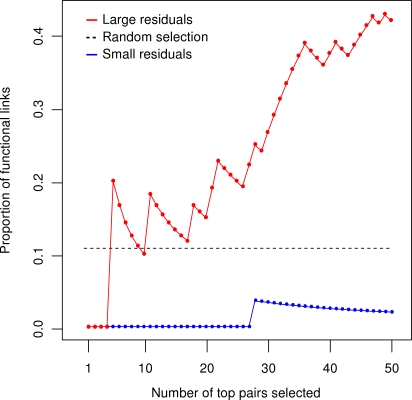
Figure 2. Relationship between the ranking of the mutation pairs and their functional links.
The proportion of shared specific functional links among the top mutation pairs, when these pairs were selected in the increasing (red) or decreasing (blue) order according to their residual errors during the approximation process. The dotted line indicates the expected rate of the functional links when selecting mutation pairs at random (the expected proportion equals 0.108).

