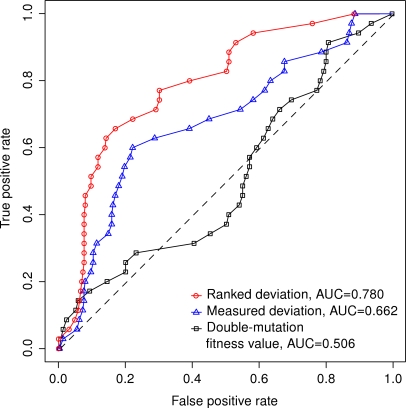
Figure 3. Predicting shared functional links using different measures of genetic interactions.
The accuracy of the prediction is evaluated using the receiver operating characteristic (ROC) curves for each measure: ranked deviations (red), measured deviations (blue), and the double-mutant fitness values (black). The true positive rate (TPR, or sensitivity) is the fraction of gene pairs correctly predicted to have functional links, and the false positive rate (FPR, or 1 - specificity) is the fraction of non-functionally linked gene pairs incorrectly predicted to have functional links. The overall prediction performance is summarized using the area under the ROC curve (AUC). For an ideal classifier, TPR = 1, FPR = 0 and AUC = 1, whereas a random classifier has on average AUC = 0.5 (the dotted diagonal line).

