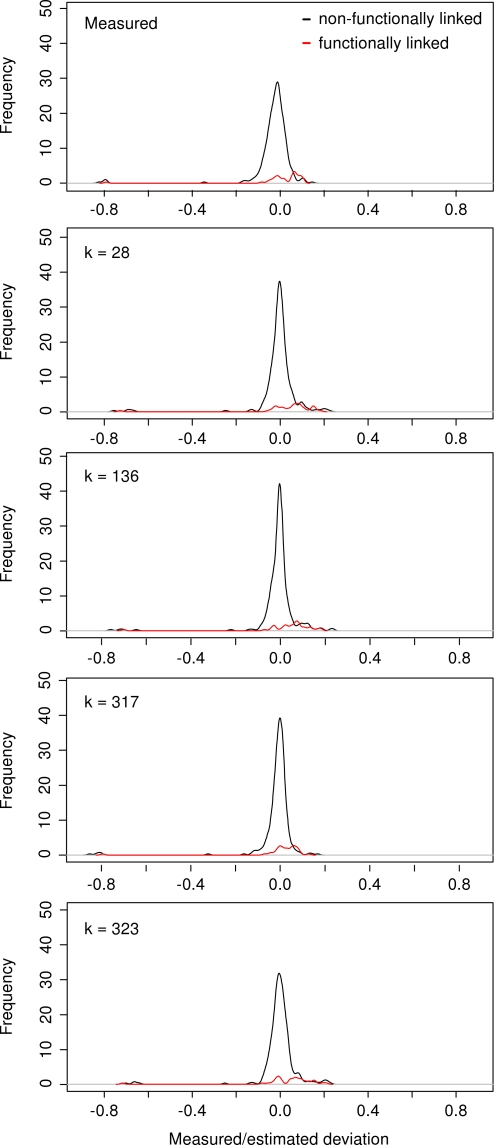
Figure 4. Distributions of the measured and estimated deviations over all mutation pairs.
Two distinct distributions are shown for the mutation pairs with specific functional links (red) and for the background pairs not sharing specific functional links (black). The measured deviations εij generate bimodal distribution for the pairs with specific functional links (the upper panel). The estimated deviations  generate background distributions with sharper peaks depending upon the size k of the subsets of mutations used in the approximation (the lower panels): k = 28 (initial subset of mutations), k = 136 (good prediction capability), k = 317 (smallest estimation error), and k = 323 (all mutation pairs). The five smallest deviation values in each distribution plot correspond to the five synthetic lethal mutation pairs. Table 1 lists the shape parameters of these distributions calculated over all of the mutation pairs. The two distributions in each individual plot are scaled according to their total number of pairs. The non-scaled versions of the same distributions are provided as Figure S3, which allows for better visual comparison between the functionally-linked and the functionally non-linked pairs.

