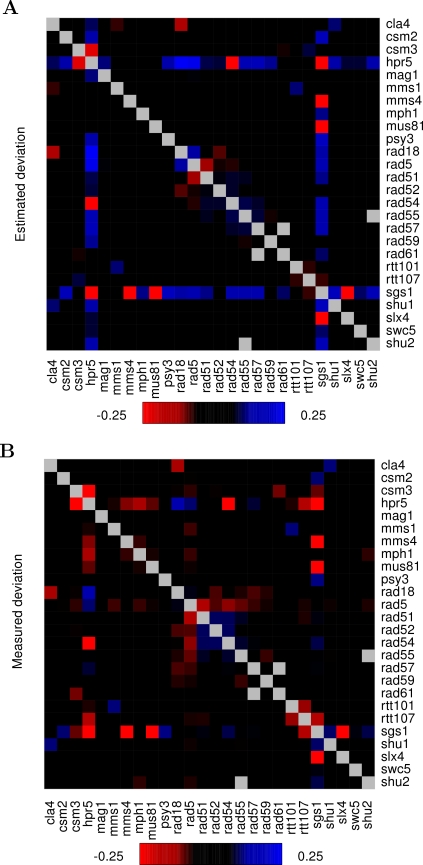
Figure 5. Estimated pairwise deviations vs. the actual measured deviations.
The color-coded heat map shows the estimated deviations (A) and the measured deviations (B) on a 26×26 grid. The estimated deviations were obtained at the cut-off point  , which generates the most ideal distribution and provides the best discrimination between the functionally-linked and the non-functionally linked pairs (see Table 1). While the five confirmed synthetic lethal pairs (sgs1Δ mus81Δ, sgs1Δmms4Δ, sgs1Δslx4Δ, sgs1Δhpr5Δ and rad54Δhpr5Δ) are clearly visible in both of the maps, there are marked differences in the more subtle interaction scores at many places of the matrix between the estimated deviations and the measured deviations εij. Red color corresponds to synergistic interaction scores and blue to alleviating interactions. The grey boxes indicate missing data points.

