
Figure 3.
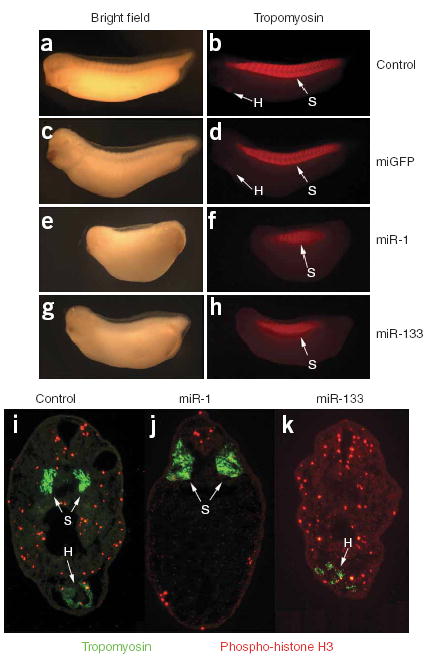
Control of cardiac and skeletal muscle development by miR-1 and miR-133 in vivo. (a–h) Images of uninjected (a,b), control miGFP-injected (c,d), miR-1-injected (e,f) and miR-133-injected (g,h) X. laevis embryos stained with anti-tropomyosin and shown at stage 32 under bright-field (a,c,e,g) or fluorescence (b,d,f,h) microscopy. Note the lack of staining for heart tissue (H, arrows) and the disruption of segmented somites (S, arrows) in f and h. (i–k) Transverse sections corresponding to the position of the heart at stage 32 in uninjected (i), miR-1-injected (j) and miR-133-injected (k) X. laevis embryos stained with anti-tropomyosin to visualize somites (S, arrows) and cardiac tissue (H, arrows), and antibody to phospho–histone H3 (red) to visualize cells in S phase. Each set of injections was conducted at least twice independently, and the phenotype was observed in at least 90% of a minimum of 50 embryos scored by whole-mount immunostaining.