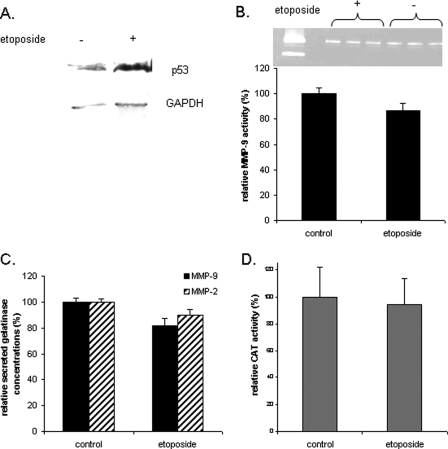
Figure 4:
Effects of etoposide on p53 expression, MMP-9 activity, MMP-9 secretion and promoter activity in first trimester CTB.
Half of the CTB were treated with etoposide (a p53 inducer) for 48 h. The untreated cells were used as control. Cells were harvested and expression of p53 was evaluated by the western blot analysis under reducing conditions (A). Secreted MMP-9 activity and concentration measured by the gelatin zymography assay (B) and ELISA (C) in the culture medium. (B) CAT activity was also assayed and normalized to the amount of proteins in the cellular lysates (D). The representative zymogram (B) corresponds to one experiment run in triplicate. However, three independent experiments, each run in triplicate, were performed and the results expressed as mean ± SEM. Relative MMP-9 activity and concentration were calculated by arbitrarily setting the activity of the control as 100. Student's paired t-test was used to compare etoposide-treated and untreated cells. GAPDH, glyceraldehyde-3-phosphate dehydrogenase.

