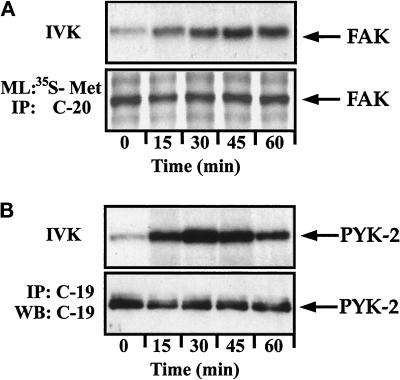
Figure 7.
Time course of LFA-1–stimulated FAK and PYK-2 activities in lymphoblasts. T cells plated on ICAM-1-Fc–coated plastic dishes were stimulated for the indicated times with 10 μg/ml mAb KIM-127 and lysed. (A) Lysates were incubated with the C-20 antibody to immunoprecipitate FAK, and kinase activities in the resulting immunoprecipitates were measured by in vitro kinase reaction performed as described in MATERIALS AND METHODS (IVK). FAK levels were determined in parallel cultures by metabolically labeling the cells with [35S]methionine and immunoprecipitation of the labeled extracts with the C-20 antibody (ML: 35S-Met and IP: C-20). The position of FAK is indicated with an arrow. (B) Lysates were incubated with the C-19 antibody to immunoprecipitate PYK-2, and kinase activities in the resulting immunoprecipitates were measured by in vitro kinase reactions (IVK). PYK-2 immunoprecipitates were also analyzed by SDS-PAGE, followed by transfer to Immobilon membranes and Western blotting with anti-PYK-2 antibodies (IP: C-19 and WB: C-19). A representative experiment is shown. The position of PYK-2 is indicated with an arrow.

