
Figure 1. Predicted Maintenance Dose versus Observed Maintenance Dose for the Caucasian algorithm.
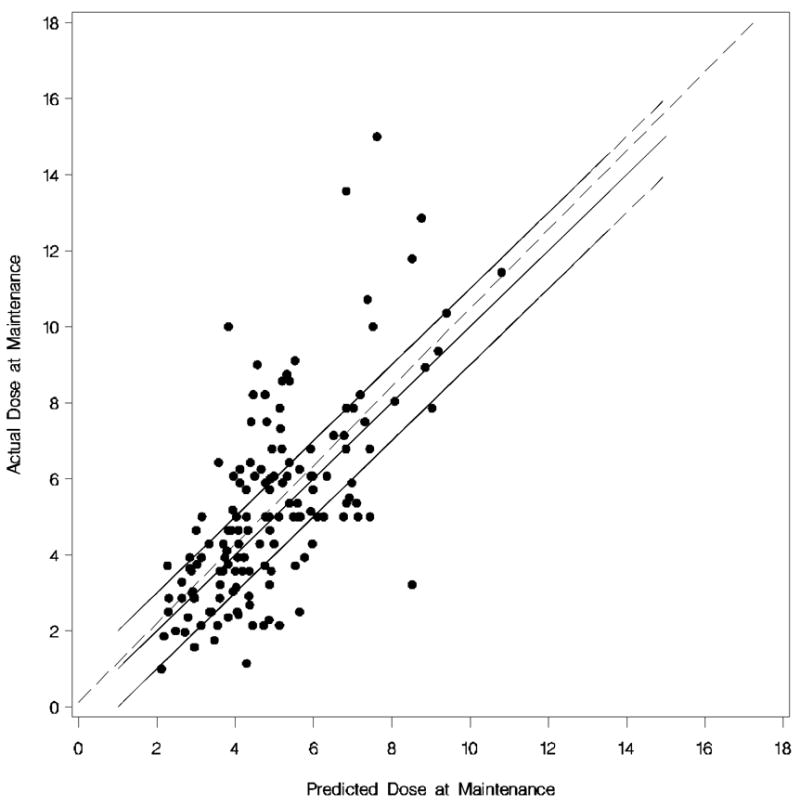
Each dot represents the observed versus predicted dose of each Caucasian. The dotted line is the linear regression line. The upper solid line is (predicted + 1 mg) of the actual dose, the middle solid line (i.e. 45% degree line) is perfect prediction, and the lower solid line is (predicted −1 mg) of the actual dose.