Figure 3.

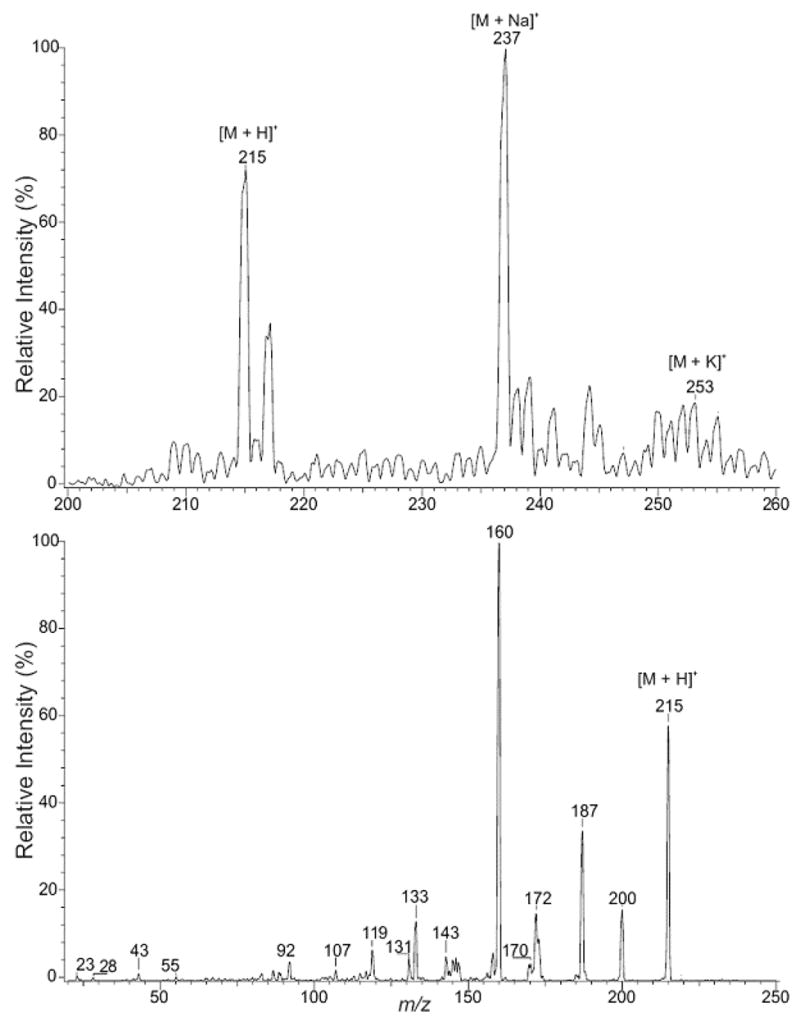
Positive-ion ESI mass spectrometric analysis of 2-OH-MeIQx. The upper panel illustrates a mass spectral scan from m/z 200 to 260. The lower panel illustrates the CAD production spectra of m/z 215.

Positive-ion ESI mass spectrometric analysis of 2-OH-MeIQx. The upper panel illustrates a mass spectral scan from m/z 200 to 260. The lower panel illustrates the CAD production spectra of m/z 215.