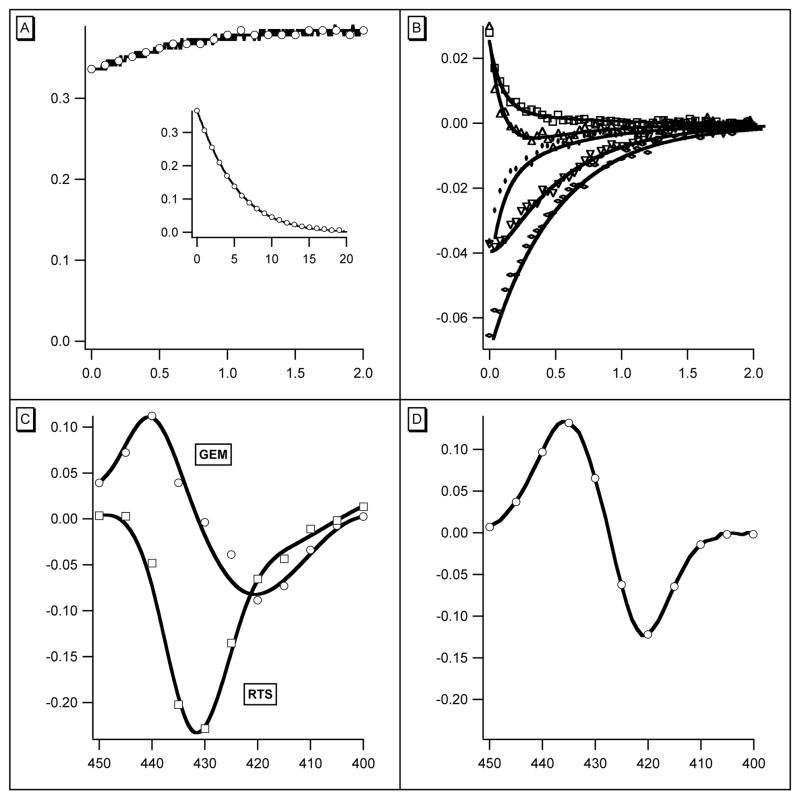
Figure 1.
(A) Absorbance change at 435 nm during the first 2μs (abscissa) after photolysis. At the beginning of the curve, absorbance (ordinate) increases after the flash. The rts is the relatively slow change that follows. Conditions: 1 mM CO, 18μM heme, 0.05M KPi, 20°, path 2mm. Inset: Complete rebinding of CO, abscissa 20 ms. (B) Data for 5 representative wavelengths from the same experiment, expanded scale. (WER comment – I think we need to identify the five wavelengths used here.) Abscissa 2.0 μs. Ordinate, change in absorbance. Points are experimental; the lines are fits to two exponentials using the same rates for all traces. Full photolysis was used in the experiment shown. (C) Coefficients for the rates used in panel B plotted against wavelength. Rates were 1.9 x 10⁷ s−1 for curve GEM (geminate) and 2.9 × 10⁶ s−1 for RTS (rts). (D) Static difference spectrum Hb2 – Hb2(CO)2 for comparison with curve GEM of panel C.

