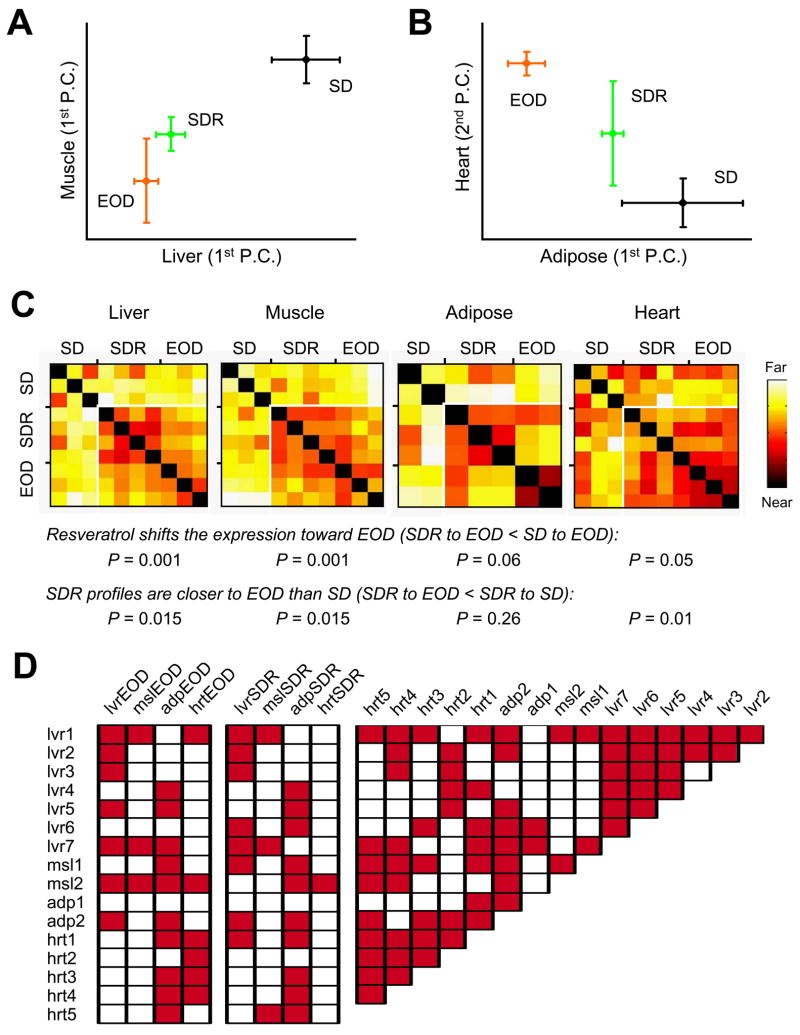
Figure 1. Resveratrol and dietary restriction have overlapping effects on gene expression.
(A, B) Principal component analysis (PCA) was performed on differentially expressed genes from SD, SDR, and EOD for liver, muscle, adipose, and heart. First PCs (the sets of correlated changes that capture the most variability between samples) for liver, muscle, and adipose are presented in panels 1A and 1B. Each shows a shift of the gene expression pattern in resveratrol-treated animals (SDR) toward that induced by every-other-day feeding (EOD). In heart, the first PC did not show this effect, however the second PC (shown) was nearly equal and did reveal a similar shift. Error bars are 95% confidence intervals. (C) Distances were calculated in high-dimensional space for each pair of samples. Each square shows the distance between two individual samples, ranging from zero (deep red, see comparisons to self on the diagonal) to highly divergent (white). In each tissue, distances between SDR and EOD samples (lower right portion) tend to be smaller than those to SD samples. P values were determined by Kruskal-Wallis (nonparametric) one-way ANOVA, and are similar, but slightly more conservative than those obtained by standard ANOVA. (D) To compare our transcriptional profiles of EOD and resveratrol treatment to published data on 10–44% caloric restriction (Corton et al., 2004; Dhahbi et al., 2005; Dhahbi et al., 2006; Edwards et al., 2007; Fu et al., 2006; Higami et al., 2004; Lee et al., 2002; Selman et al., 2006; Tsuchiya et al., 2004), we generated differential expression signatures (Swindell, 2008). For each pair of transcriptional profiles, the significance of the overlap in expression changes was evaluated by permutation testing and adjusted for multiple comparisons using the Benjamini-Hochberg method (Benjamini and Hochberg, 1995). Publicly available datasets are assigned a name based on the tissue examined and described in detail in Table S2. Shaded boxes indicate significant associations (P < 0.05).

