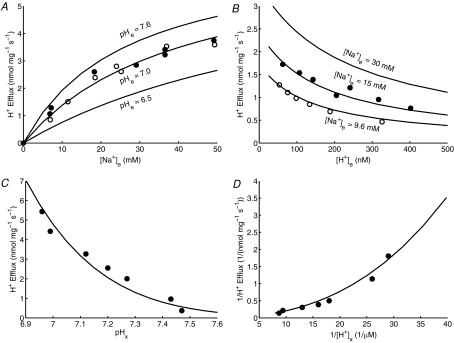
Figure 4. Fitting of Na+–H+ exchanger (NHE) model (lines) to data (points) on NHE fluxes.
The initial rates of H+ efflux or Na+ influx were measured: A, with varying external buffer [Na+] and fixed external buffer pH = 7.0 and matrix pH = 6.95 in purified mitochondria from rat heart (the filled circles are the measured H+ efflux rates while the open circles are the calculated H+ efflux rates from the measured rates of decreased matrix pH with a fixed matrix buffering capacity of 36 nmol H+ mg−1 (pH unit)−1) (Kapus et al. 1989), and B, with varying external buffer pH and fixed external buffer [Na+] = 9.6 mm and 15 mm and matrix pH = 7.0 in purified mitochondria from rat liver (Kapus et al. 1988). The model fits to these data sets with KNa,NHE = 22 mm and XNHE = 12 nmol mg−1 s−1 (for both Na+ influx and H+ efflux). C and D, the fitting of the same kinetic model to another data set is shown where the initial rates of decrease in matrix pH or H+ efflux in rat heart mitochondria were measured with varying matrix pH and fixed external buffer pH = 7.0 and [Na+] = 50 mm (Kapus et al. 1989). For the kinetic model to fit this data set, the XNHE value is adjusted to 18 nmol mg−1 s−1 while keeping the KNa,NHE value fixed at 22 mm.

