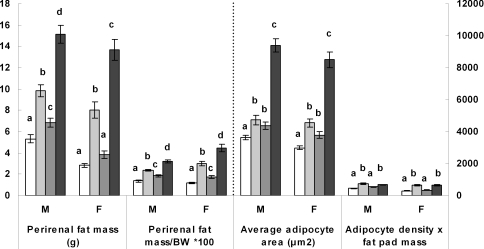
Figure 2. Histological data.
Perirenal fat pad mass, perirenal fat pad mass relative to body weight (BW), average adipocyte area and (adipocyte area × fat pad mass) in male (M) and female (F) offspring from the various dietary groups. Keys: open bar: CCC group, chow throughout; lightly shaded bar: CCJ group, chow in pregnancy and lactation followed by junk food diet after weaning; darkly shaded bar: JJC group, junk food diet in pregnancy and lactation followed by chow after weaning; black bar: JJJ group, junk food diet throughout. Results are mean ± s.e.m. Different letters indicate statistical differences (P < 0.05) by hierarchical two-way ANOVA followed by post hoc analyses with n = 18 males and n = 18 females in each nutritional group.

