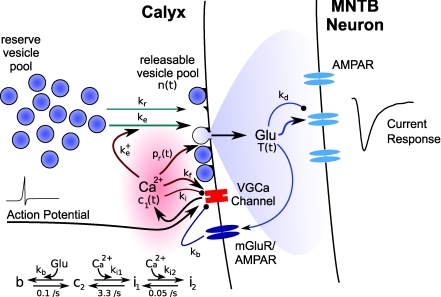
Figure 1. Schematic illustration of the different signalling pathways included in the model.
Arrows indicate positive and filled circles negative interactions. Green lines indicate pathways implicated in vesicle trafficking, red lines the calcium-dependent processes, and blue lines the glutamate-dependent processes. Processes that are strongly activated by a single presynaptic action potential are drawn as thick lines. Variable names and rate constants are specified as used in eqns (1)–(10). The kinetic scheme summarizes eqns (6)–(10). Abbreviations: Glu, glutamate; VGCa Channel; voltage-gated calcium channel; mGluR, metabotropic glutamate receptor; AMPAR, AMPA receptor. See Methods for a detailed description.

