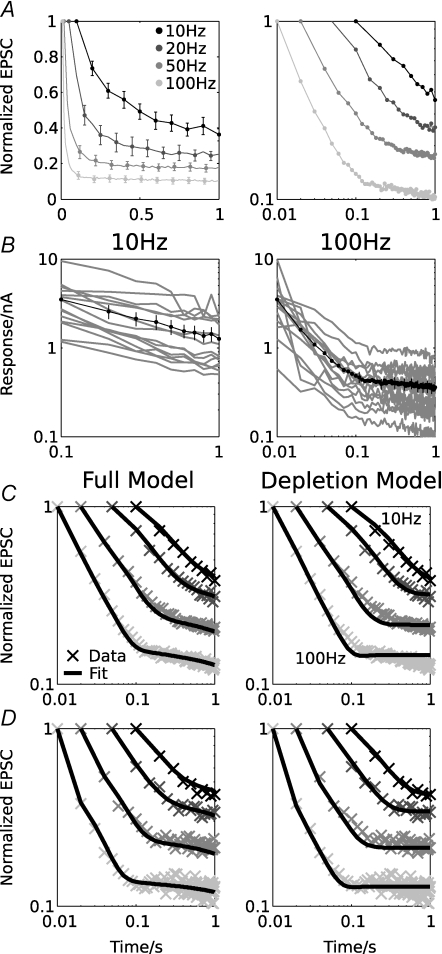
Figure 2. Time course of synaptic depression at the calyx of Held and model fits.
A, depression of the EPSC amplitude (normalized, average data from n = 14 cells) during stimulation lasting 1 s at 10, 20, 50 and 100 Hz in linear (left) and double-logarithmic (right) coordinates. B, average EPSC amplitudes from all 14 cells (grey) and the population average (black) for 10 Hz (left) and 100 Hz (right) stimulation, plotted in double-logarithmic coordinates. Note that all cells show an initial depression approximating a power-law time course, which then terminates into a slower decay. C and D, experimental data for all frequencies (crosses) and model fits (black lines) for the whole population (C) and an individual cell (D) for the full model (left), and the reduced ‘depletion model’ (right), which does not include slow calcium channel inhibition. Only the full model can accurately fit the late, slow EPSC decay at high frequencies. Parameters are as follows. Pooled data, full model: Table 1; pooled data, depletion model: ke = 0.19 s−1, C0 = 0.2522, kd = 2.13 s−1, τd = 0.032 s; single cell, full model: ke = 0.57 s−1, C0 = 0.4071, kd = 2.56 s−1, τd = 0.019 s; single cell, depletion model: ke = 0.34 s−1, C0 = 0.3862, kf = 0.036 s−1, kd = 2.39 s−1, τd = 0.025 s. Error bars in A and B show ± 1 s.e.m.

