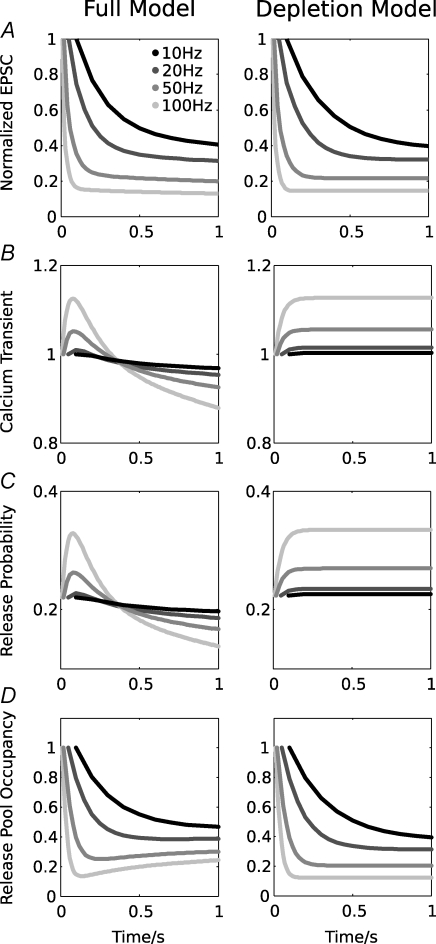
Figure 3. Comparison of the full (left plots) and simpler depletion model (right plots).
Normalized mean EPSC amplitudes and model fits for 10, 20, 50 and 100 Hz stimulation, replotted from Fig. 2, are shown in A. Further shown are the normalized amplitude of the simulated calcium release transient (B), the resulting release probability (C) and the normalized vesicle pool occupancy (D). Note that a slow reduction of the release probability leads to partial vesicle pool recovery in the full model.

