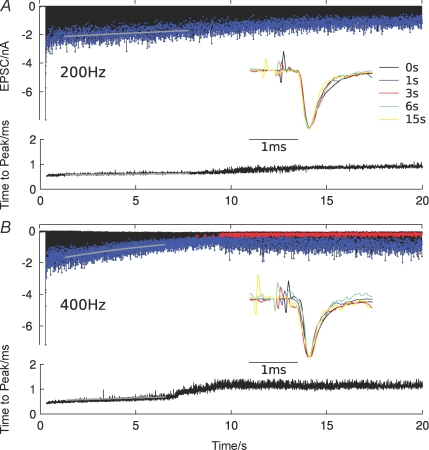
Figure 4. A slow EPSC amplitude run-down continues during prolonged stimulation at high frequencies.
A, EPSCs recorded during 20 s stimulation at 200 Hz (A) and 400 Hz (B) at 37°C. Stimulation artifacts were removed for clarity. Blue dots indicate individual EPSC peaks, and grey lines show exponential fits of the EPSC peak amplitude decay. In B, red dots show presynaptic action potential failures. Insets show normalized EPSCs at different time points after stimulus onset (stimulus artifacts were rescaled for clarity). Below, the latency between the positive deflection of the stimulus artifact and the EPSC peak (time to peak) is shown. Grey lines show exponential fits.

