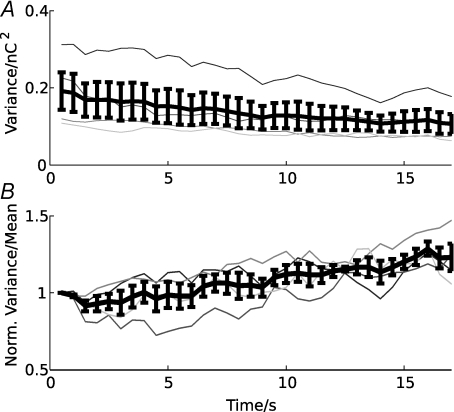
Figure 5. Single-trial variance/mean analysis of EPSCs during stimulation at 200 Hz.
Mean and variance of the EPSC charge, integrated over 1 ms, were estimated from the EPSCs in a sliding window (window size 2 s; step size 1 s; beginning at 0.5 s after stimulus onset). A, estimated variance for four single cells (grey curves) and the average variance (black curve). B, variance/mean ratio for single cells (grey curves) and the average ratio (black curve), normalized to the first bin. Error bars show ± 1 s.e.m.

