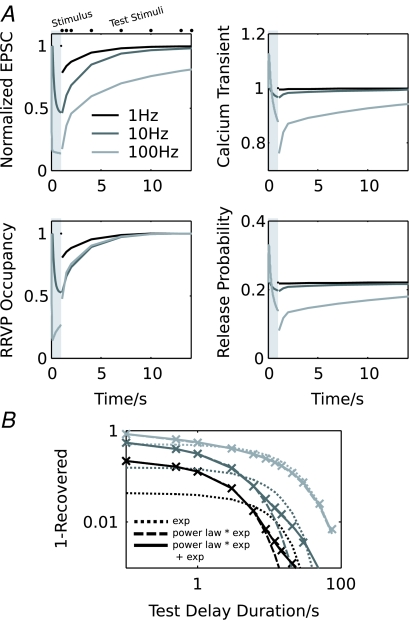
Figure 7. Recovery from synaptic depression is frequency-dependent in the model.
A, stimulation-evoked changes and recovery curves of the EPSC amplitude (top left), the RRVP occupancy (bottom left), calcium release transient (top right) and corresponding release probability (bottom right). Conditioning stimuli were presented for 1 s at 1, 10 and 100 Hz, and recovery curves were obtained by applying test stimuli at different intervals after the conditioning stimulus. B, the EPSC recovery curves from A, replotted in a double-logarithmic representation (data points shown by crosses). Dotted lines: exponential fits to the late part of the recovery curves; dashed lines: fits with a power-law function multiplied by an exponential (eqn (13)); continuous lines: fits with a sum of the product of a power-law and an exponential and an additional exponential.

