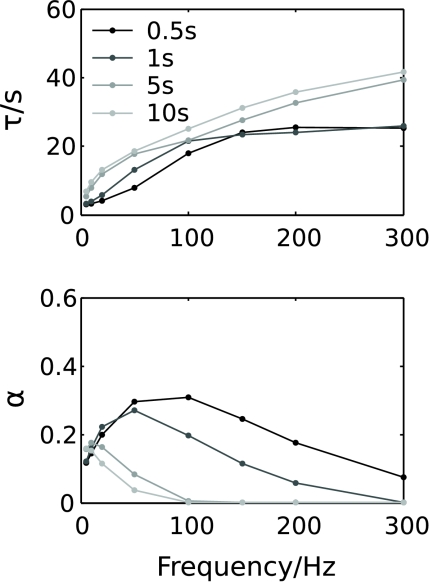
Figure 8. Summary of the effects of stimulus frequency and duration on recovery from synaptic depression.
The exponential decay time constant τ (top) and the estimated slope α of the power law (bottom) according to eqn (13) as a function of stimulus duration for stimuli at 10, 50 and 100 Hz.

