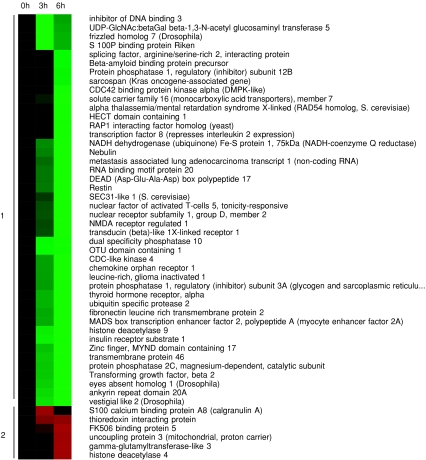
Figure 1. Gene expression profiling of the response of human skeletal muscle to IL-6 infusion.
Hierarchical clustering of the expression pattern of significantly (P < 0.05) changed genes over time (not compared with a control group) in human skeletal muscle following an IL-6 infusion from 0 h to 3 h, with more than a 2-fold increase or decrease, as described in Methods. Red indicates up-regulation and green indicates down-regulation.

