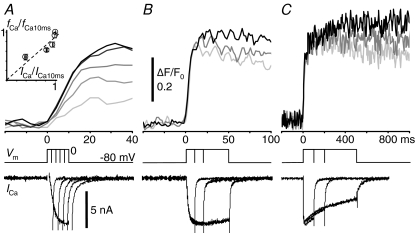
Figure 5. Time course of CICR during continuous Ca2+ entry.
A–C, F/F0 rises elicited by depolarizing pulses to 0 mV with various durations. Pulse durations were 2–10 ms in A, 10–50 ms in B, 100–500 ms in C, respectively. The darker trace was the F/F0 rise elicited by the pulse of longer duration. F/F0 traces were obtained at 4 ms linescan−1 from the cytoplasm within 2 μm of the plasma membrane, averaged over 2 traces and smoothed by moving average over 12 ms. The traces in different panels were from different neurons. Vm and ICa are shown below. The inset in A shows the correlation of ICa at the ends of 2–10 ms depolarizing pulses with the resulting rates of CICR (fCa), obtained from 12 neurons. ICa and fCa were normalized to those evoked by a 10 ms pulse (ICa10ms and fCa10ms, respectively). The plot was fitted with a straight line (dashed line; slope, 0.89; r2 value, 0.68).

