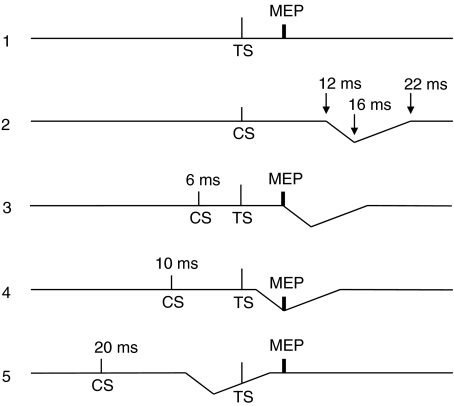
Figure 11. Model explaining the inhibition of the conditioned MEP observed at ICF interstimulus intervals (10 and 15 ms).
TS is the magnetic test stimulus, which was able to produce in active masseter muscles a test MEP (trace 1). CS is the magnetic conditioning stimulus, which was unable to induce in active masseter muscles a MEP, but rather induced bilateral EMG suppression (represented by the downward deflection of the trace) with onset and time course indicated in trace 2. When both CS and TS are given (traces 3–5) no interference of the acoustically induced silent period with the MEP occurs at ISIs < 6 ms, while this interference occurs at ISIs > 6 ms. In particular maximal interference occurs at 10 ms ISI as MEP falls exactly at the time of maximal peak of inhibition (10 ms ISI + 6 ms MEP latency = 16 ms) of masseter EMG (trace 4). This model fits with the time course illustrated in Fig. 2B.

