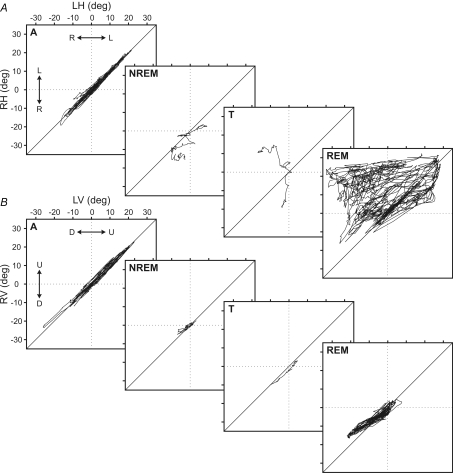
Figure 6. Interocular disparity plots for horizontal and vertical eye movements along the sleep–wake cycle.
Each square represents right versus left eye trajectories for horizontal (RH, LH) (A) and vertical (RV, LV) planes (B) along alertness (A), non-REM sleep (NREM), transition period (T), and REM sleep (REM) during one representative sleep–wake cycle in one cat. A, during alertness, eye movements were conjugated and their trajectory was distributed along the bisecting line. During REM and NREM sleep plots, eye positions were distributed over and under the bisecting line, showing a trend of tonic convergence and divergence, respectively. This reversion between divergence and convergence occurred during the transition period. B, in the vertical plane, trajectory points were similarly distributed along the bisecting line during the whole sleep–wake cycle, showing a lower interocular disparity in the vertical plane.

