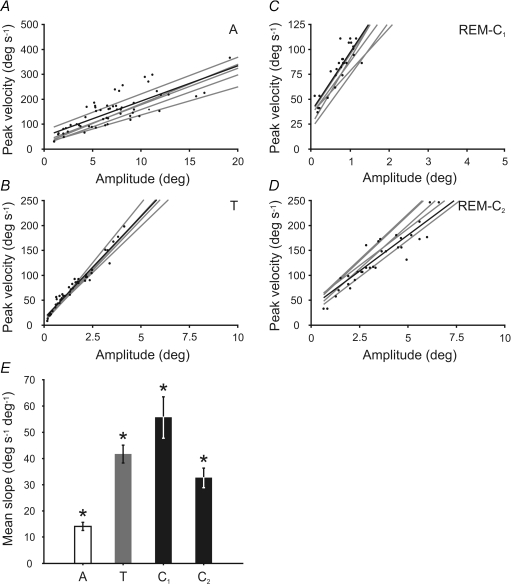
Figure 10. Comparison of rapid eye movement during alertness and sleep.
Relationship between peak eye velocity and amplitude in the horizontal plane during saccadic eye movements in alertness (A), rapid eye movement in the transition period (B), and during the first (C) and second (D) components of rapid eye movements during REM sleep. Data for a representative period and their corresponding regression line are plotted in black. Grey lines represent regression lines for other analysed episodes in each period. The scales of the plots have been proportionally modified to facilitate slope comparison. E, mean slope comparison for each type of rapid eye movement during 6 sleep–wake cycles. Asterisk on a bar indicates the existence of statistical differences with the rest of the bars (P < 0.01).

