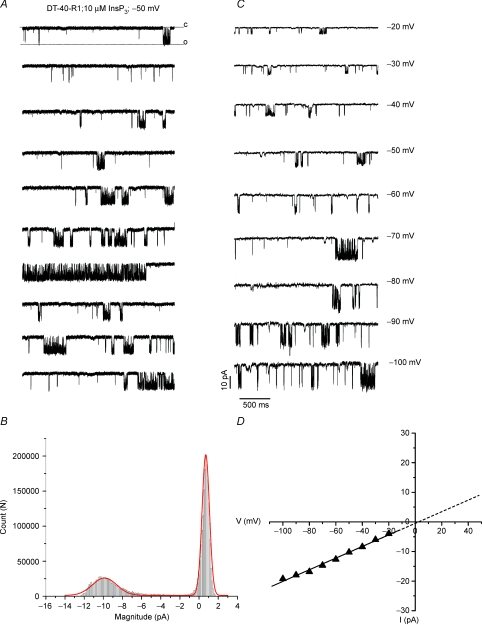
Figure 1. Channel activity in the PM of DT40 cells expressing InsP3R-1.
A, whole cell patch clamp recording of single channel InsP3R-1 activity in an individual DT-40 cell stably expressing WT InsP3R-1 using the standard recording solutions as described in Methods. Individual 3 s sweeps at −50 mV. C = closed; O = open state. B, all-points current amplitude histogram. Activity was detected using pCLAMP's event detection paradigm. Red trace shows bimodal Gaussian fit of the data. C, individual sweeps at the indicated potential. D, I–V relationship generated from the peak current amplitudes at each potential in C; the slope conductance is ∼200 pS.

