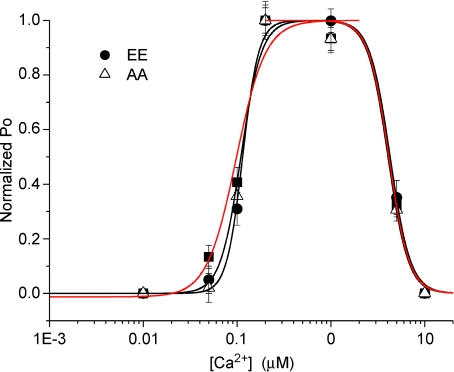
Figure 9. Cytosolic Ca2+ dependency of phosphorylation state mutant InsP3R-1 constructs.
Pooled data from cells expressing AA or EE InsP3R-1 at the [Ca2+] indicated and a pipette solution containing 0.5 μm ADO and 0.5 mm ATP. The Po was normalized to the maximal Po for each construct (n > 5 for each [Ca2+]). The black curves are the Hill equation fits of the AA and EE InsP3R-1 data. The red curve represents the Hill equation fit of the WT InsP3R-1 data reproduced from Fig. 3. The Ca2+ dependency for the activation or inhibition of InsP3R-1 activity was not significantly different when comparing either construct or when compared to WT InsP3R-1 (see Fig. 3).

