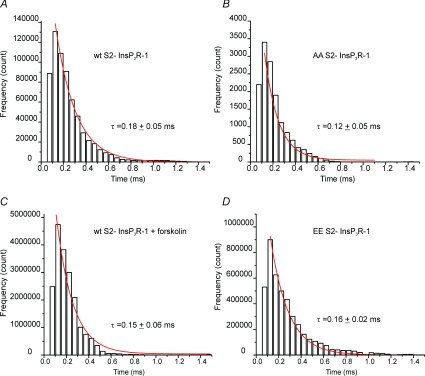
Figure 10. Distribution of InsP3R-1 open dwell times during bursting activity.
The open times were plotted for the indicated constructs/conditions and the distribution was fitted with a single exponential decay, shown in red. The τ was derived from this fit. A, WT InsP3R-1. B, AA InsP3R-1. C, WT InsP3R-1 following addition of forskolin. D, EE InsP3R-1. The τ derived under these various conditions was unaltered.

