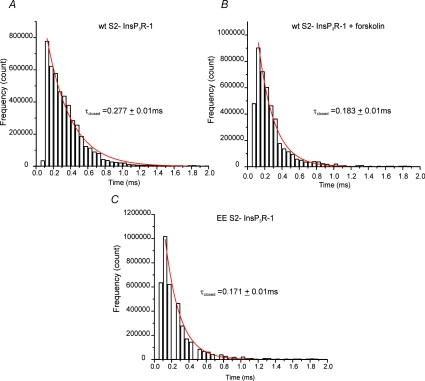
Figure 11. Distribution of InsP3R-1 closed dwell times during bursting activity.
The closed times were plotted for the indicated constructs/conditions and the distribution was fitted with a single exponential decay, shown in red. The τ was derived from this fit. A, WT InsP3R-1. B, WT InsP3R-1 following addition of forskolin. C, EE InsP3R-1. Phosphorylation significantly shortened the τ, thus favouring channel opening.

