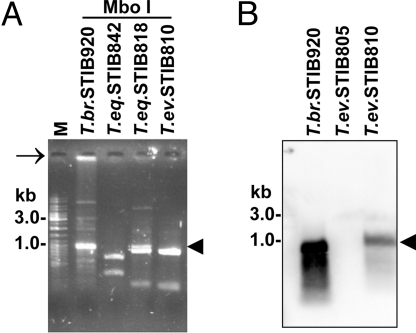
Fig. 2.
Minicircle homogenization (A) and/or absence (B). (A) EtdBr-stained agarose gel showing restriction analysis of kDNA minicircles from representative strains using MboI (see also SI Fig. 11). Linearized minicircles are indicated by an arrowhead. Note the presence of kDNA network in the slot of the T. brucei lane (arrow). (B) Southern blotting of total DNA isolated from representative strains and digested with restriction enzyme TaqI. The membrane was hybridized with a radiolabeled probe prepared from total T. brucei minicircles.

