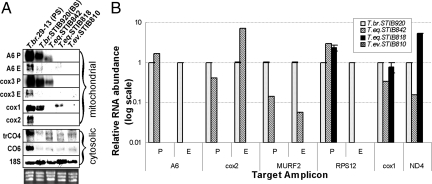
Fig. 3.
Transcript levels (A) and RNA editing (B). (A) Levels of mt and cytosolic transcripts detected by Northern blotting in representative strains of T. brucei, T. equiperdum, and T. evansi. P, preedited; E, edited; A6, ATP synthase subunit 6; cox1–3, cytochrome oxidase subunits 1–3; trCO4, trypanosome cytochrome oxidase subunit 4; CO6, cytochrome oxidase subunit 6; 18S, 18S ribosomal RNA. As a control, the gel was stained with EtdBr to visualize rRNA bands. (B) RNA editing of some mRNAs is affected in the Dk/Ak cells. Real-time PCR analysis of preedited, edited, and never-edited mRNAs, performed in triplicate on cDNAs. For each target amplicon, the relative change in RNA abundance was determined by using cytosolic transcripts of β-tubulin and 18S rRNA (data not shown) as internal references, because their transcription was not affected. The relative abundance of each examined transcript was plotted on a logarithmic scale: 1.0 represents the level in BS of T. brucei STIB920; A6, ATPase subunit 6; cox2, cytochrome oxidase subunit 2; MURF2, maxicircle unknown reading frame 2; RPS12, ribosomal protein S12; never-edited cox1 mRNA; and ND4, NADH-dehydrogenase subunit 4.

